Automated Debug Scan for VM Internal Scanner
The debug scan provides users with sufficient verbosity logging details to identify any of the issues that occurred during the standard scanning process. This scan affects the target as any standard scan, with additional logs for troubleshooting purposes.
Enabling the customers to perform Automated Debug scans, avoids the dependency on the Qualys Customer Support team to change the operational mode of the scanner to Debug. The Customer can launch the Debug Scan from the Scan Launch Screen with only one IP Address. With this, the scanner is automatically set into Debug Mode, and post the completion of the scan, the scanner will automatically revert to the Standard operation mode, and the Customer can continue with their traditional scanning activity planned during that time.
Note: Debug Scans can run for a longer duration, based on the QIDs that are configured in the Option Profile and with the selection of the Scanner Debug Modes. This may have an impact on any on-demand or scheduled scans that are planned while the debug scans are in progress.
Enable Debug Scan
The "Debug Scan" feature needs to be enabled for your subscription. Contact your POC or Manager user.
Enable Debug Scan in the UI
Once the "Debug Scan" feature is available in your subscription, enable & save the settings.
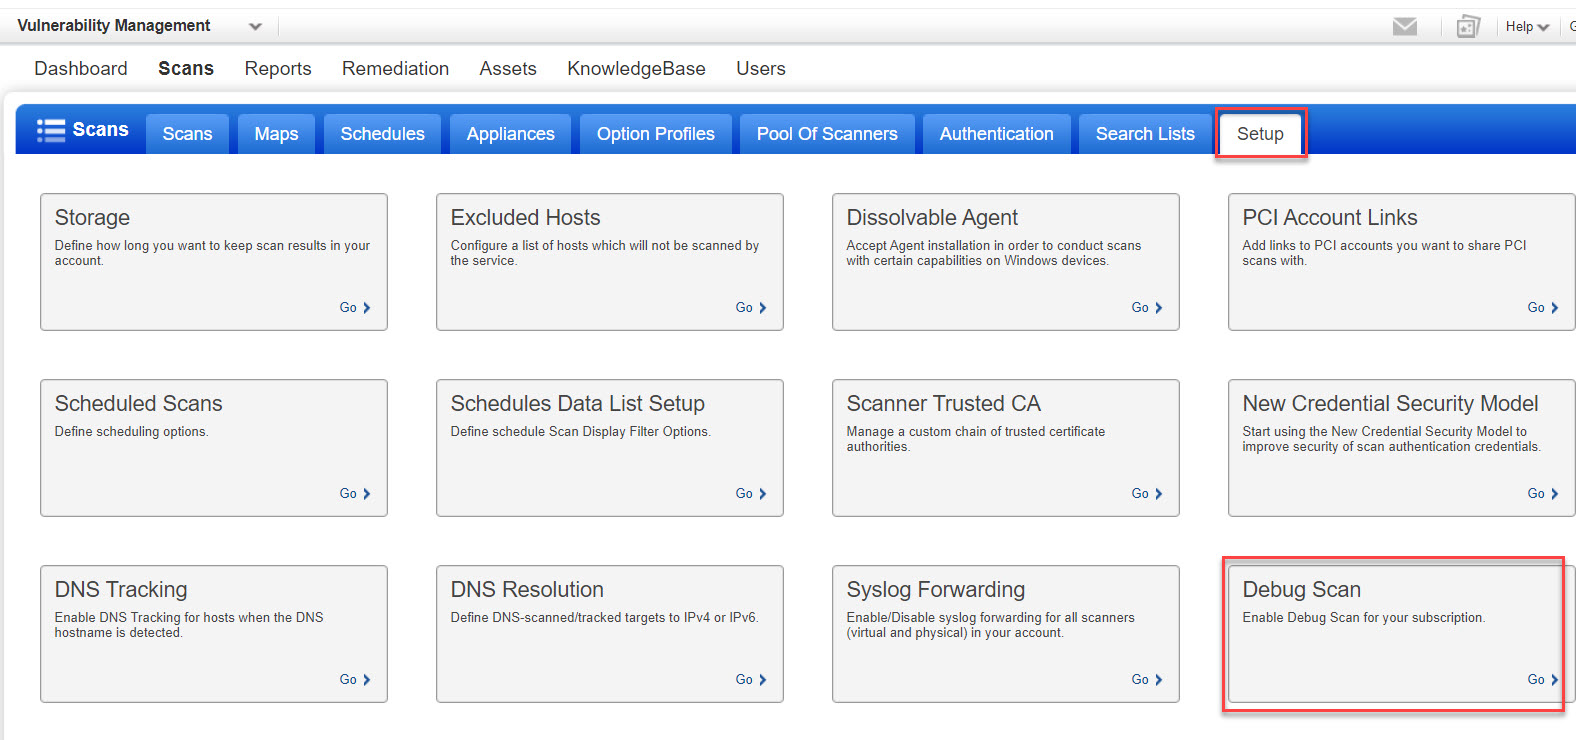
1) Launch the Debug Scan feature from the Setup UI
2) Select the "Enable Debug Scan" & click "Save"
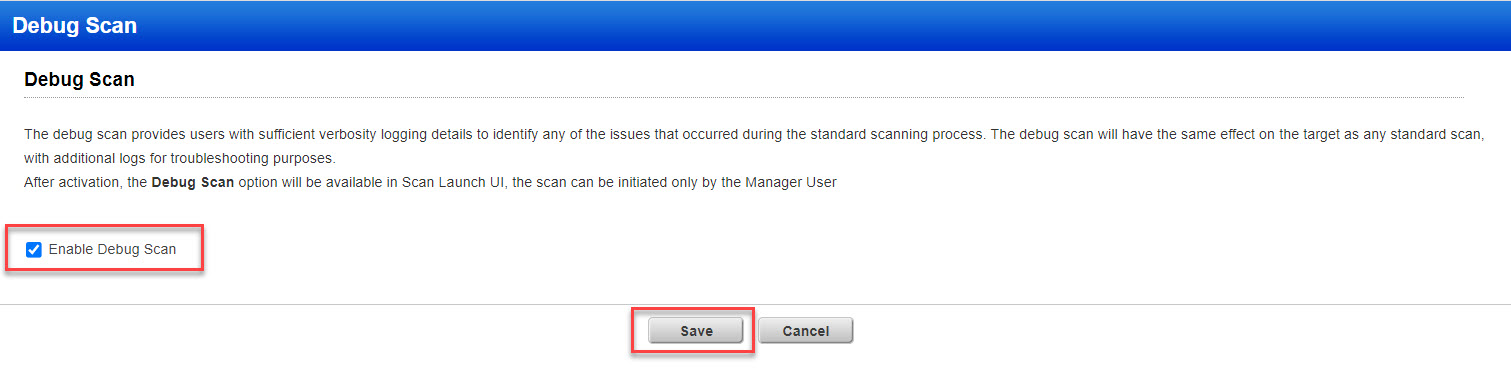
After activation, the Debug Scan option will be available in Scan Launch UI, the scan can be initiated only by the Manager User.
Note: Enable Debug Scan is enabled by default for all new VMDR subscriptions.
Let’s launch a Debug scan
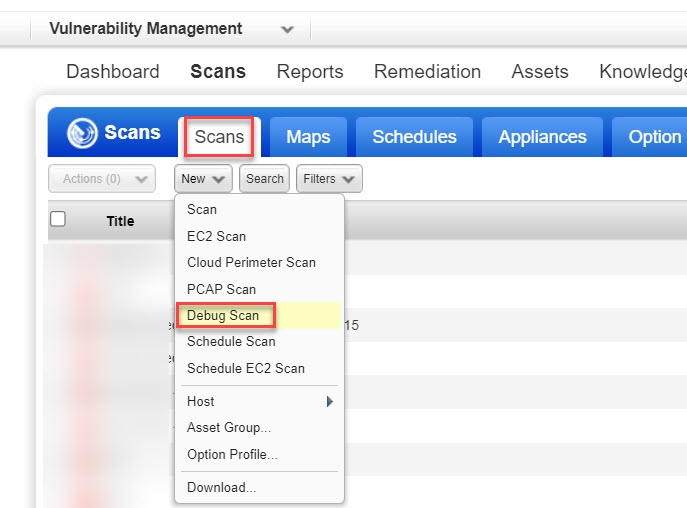
1) Go to VM/VMDR > Scans > Scans > New > Debug Scan
2) Provide General Information
In the Launch Debug Scan window, the first section you'll see is the General Information section. This is where this is where you can add Title, Option Profile, Processing Priority and much more. Each option is described below.
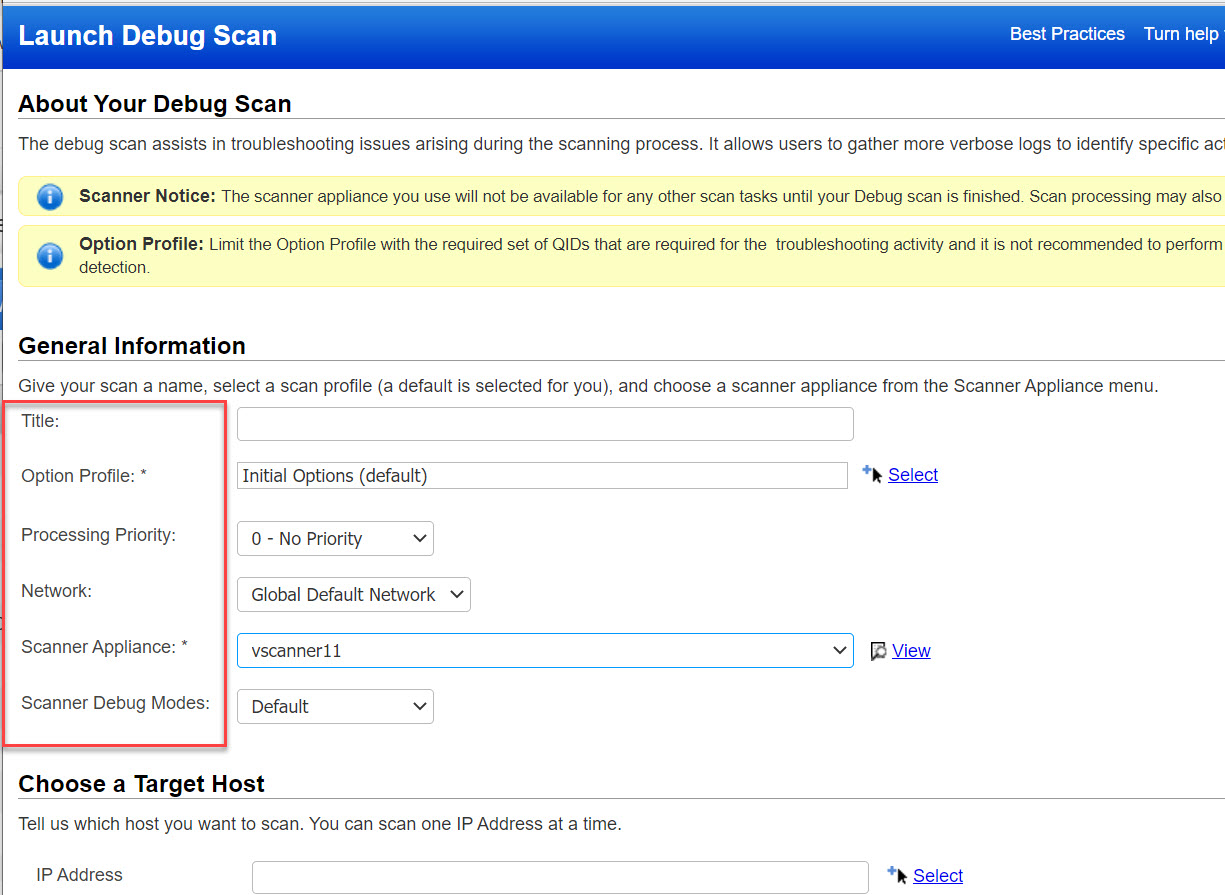
Title - Give your scan a title to easily identify it later.
Option Profile - Select an option profile for this scan job. The option profile has scan settings like which ports to scan, which QIDs to scan, and whether to use authentication. The option profile designated as the "default" profile for the subscription is recommended. You can use the default or pick another option profile from the list. Get help choosing an option profile
Note: Limit the Option Profile with the required set of QIDs for the troubleshooting activity & it is not recommended to perform with complete vulnerability detection.
Processing Priority - By default, the priority level is set to 0 for the debug scan. Get help choosing processing priority
Network - (Visible only when the Network Support feature is enabled for your subscription.) Select the network you want to scan. The Global Default Network is selected by default but you can choose a user-created network from the list.
Scanner Appliance - Qualys recommends customers initiate the Debug Scans, while the scanner is fully available to ensure that, there is no overlap to scheduled/on-demand scans. After completing the Debug Scans, the Scanner Appliance will automatically revert to normal.
Click here to see your Scanner Appliance optionsClick here to see your Scanner Appliance options
Scanner Debug Modes - You can run the debug scans in different debug modes depending on the amount of logging level required based on the issue for which debug scan is run. There are 3 debug modes available
- Default - This is the lowest logging level in the case of debug scans. It can be run for issues such as Host Not alive, FP/FN issues, etc.
- Standard - This is the middle logging level for debug scans. The scanner will log more events as compared to the default debug level. This is generally used for Web application scanning-related issues.
- Advanced - This is the highest level of debug scan that can be run from the UI. This can be run for issues such as authentication, OS fingerprinting, and some specific FP/FN issues. This will only apply if the scan has fewer than 20 QIDs.
3) Tell Us What To Scan
In the Launch Debug Scan window, the second section you'll see is the Choose a Target Host section. This is where you specify IP address, IPv6 address and FQDN(s). Each option is described below.
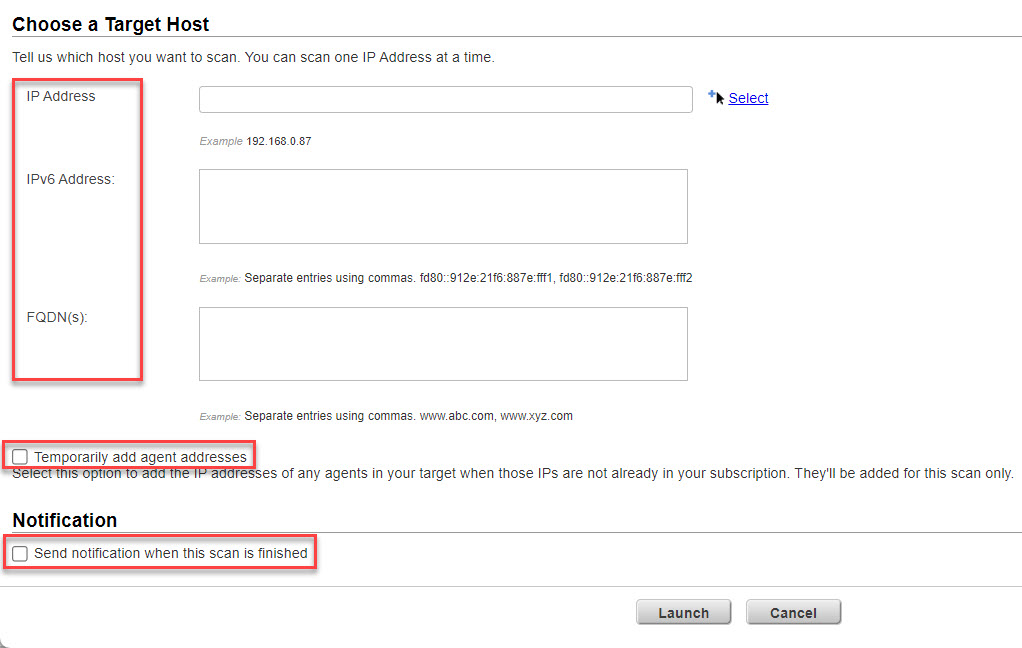
IP Address - Enter the IP address for which you need to run the debug scan.
IPv6 Address - Enter the IPv6 address/range you want to scan.
Note: You can scan one IP address at a time.
FQDN(s) - (Visible only when the DNS Tracking feature is enabled for your subscription.) When this feature is enabled, you'll see the FQDNs input field where you can enter a comma separated list of Fully Qualified Domain Names to scan (e.g. www.abc.com, www.xyz.com). Enter up to 4000 characters. Each FQDN must resolve to an IP address in your VM account to successfully scan it and view the results. The Scan Results report shows the FQDN information in the Report Summary section. Click here to learn how to enable this featureClick here to learn how to enable this feature
To enable this feature, the Manager primary contact goes to Scans > Setup > DNS Tracking and checks the option Enable DNS Tracking for hosts.
Temporarily add agent addresses - You need to select this option if your scan target includes agents that may have acquired IPs not in your subscription. Without this option, the scan will not execute and will generate an error due to the addresses not being in your subscription. This option temporarily adds the IP addresses of any agents in your target to your subscription for this scan only. This option cannot be used with the External scanner option. Learn more about hosts with agents
4) Enable Scan Notification Email
(Optional) Select Send notification when this scan is finished if you'd like an email notification with a custom message to be sent to you and others when this scan is finished.
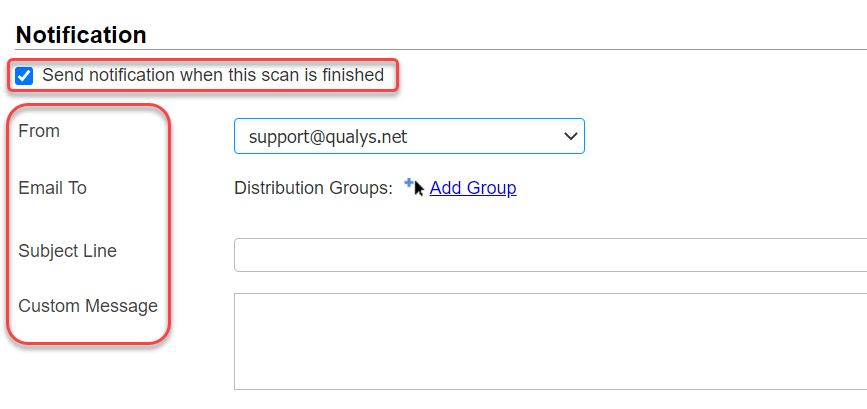
From - Select the email address that should appear in the From line of the email. You can choose the Support email or your own.
Email To - Tell us who to notify when this scan is finished. You'll do this by selecting distribution groups. Click Add Group. Then, in the window that appears, select a group in the list to see details about the group, and click Add to list to add the group to the notification. Learn more about distribution groups
Subject Line - Enter text that will appear in the Subject line of the email.
Custom Message - Enter a custom message that will appear in the body of the email.
5) Click the Launch button
Once you've provided all the scan information, you're ready to launch the scan. Click Launch and your debug scan will be launched.
Note: When the Debug Scan is running, you will not be able to Pause/Resume/relaunch the scans.
Post Completion of Debug Scans
After completing the Debug Scans, the Scanner Appliance will automatically revert to normal.
The Customer must manually download the Scan Results in PDF format (for the Debug Scans) and then share it with the Qualys Support team. They will leverage backend tooling and reference numbers from the Scan PDF to retrieve, decompress, and de-obfuscate that log file which could potentially contain sensitive information.